Excel Sales Analysis
The goal of this project is to to leverage Excel's powerful data manipulation, visualization, and analysis capabilities to gain insights into sales performance, identify trends, and support strategic decision-making. Monitor sales performance over time to evaluate how the business or specific sales persons are performing.
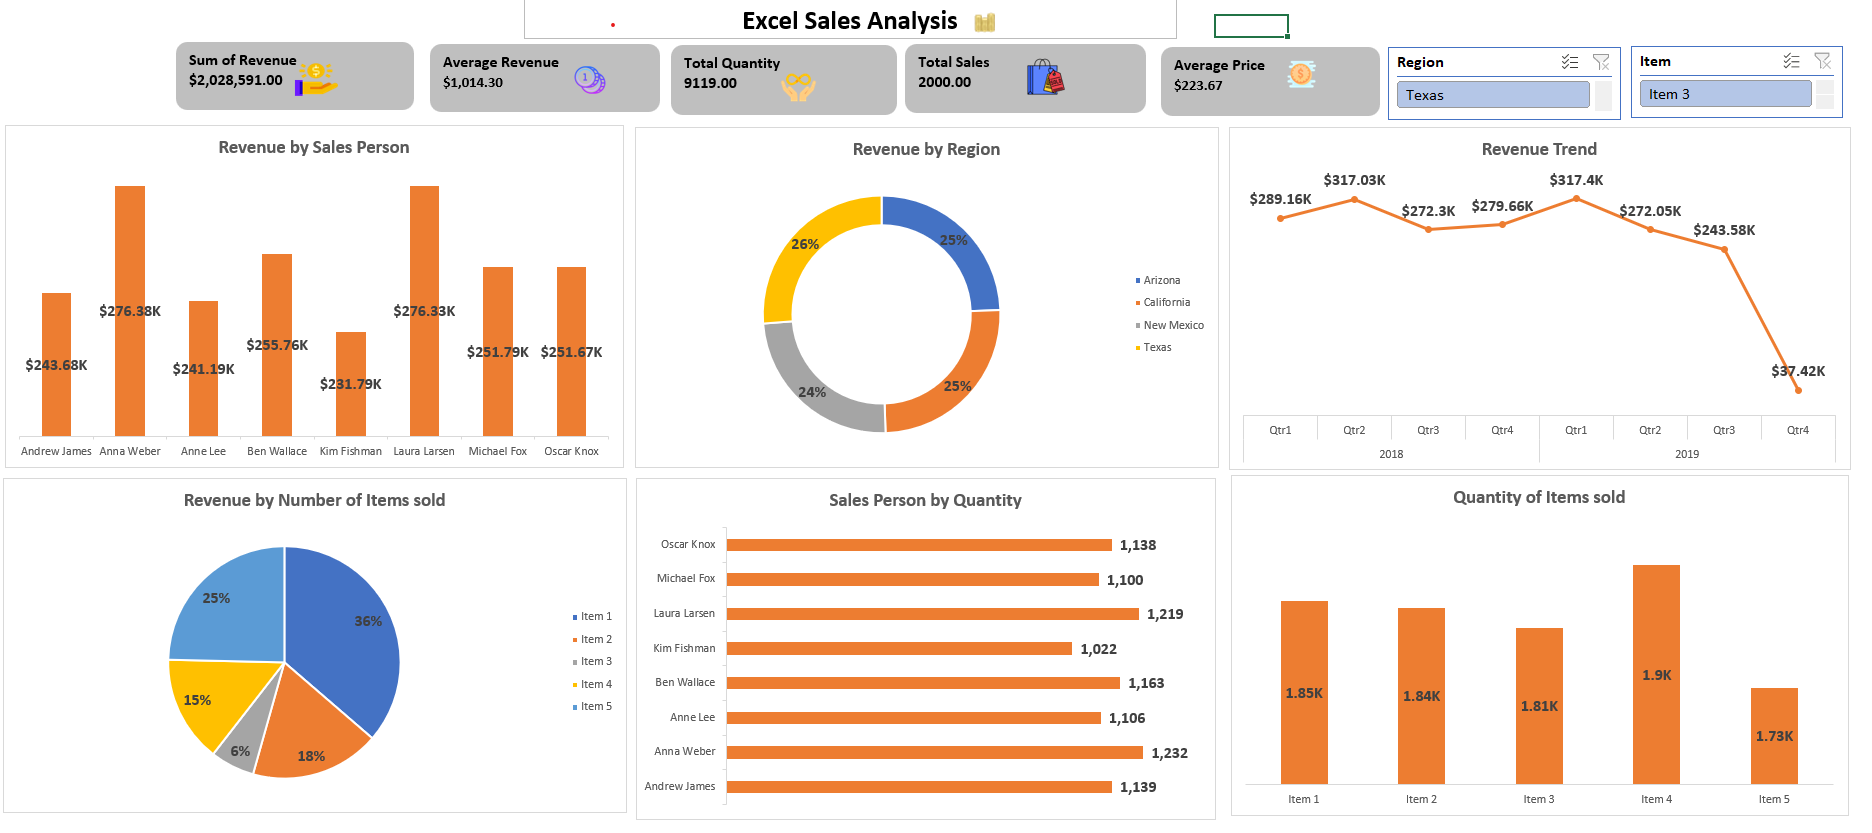
Key Insights:
✪ Texas region had the highest revenue by region with 26%, while New Mexico had the lowest revenue by region with 24%.
✪ Item 1 had the highest revenue by number of items sold, while Item 4 had the lowest revenue by number of items sold.
✪ Quarter 1, 2019 had the highest revenue trend, while Quarter 4, 2019 had the lowest revenue trend.
Recommendations:
✪ Sales performance can vary greatly by region, customer, product, or other factors. Segmenting your data can reveal more targeted insights.
✪ Use Excel’s forecast or trend function to predict future sales based on past performance.
✪ Set up systems within Excel to compare actual sales performance against sales targets, highlighting areas of underperformance or overachievement.